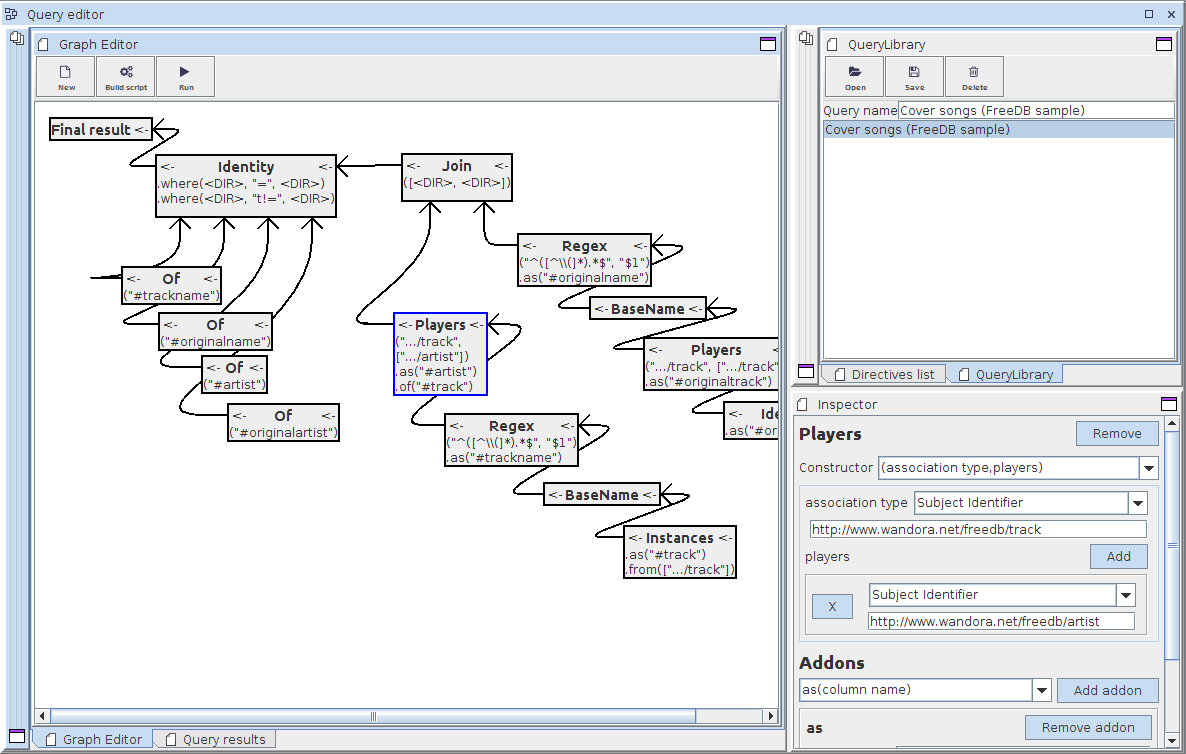
Query editor topic panel
This is an upcoming feature and is not included yet in the public release.
Query editor topic panel is one of several different topic panels in Wandora. Its main purpose is to provide a graphical editor for the Wandora query language, and a way to execute the queries in a topic panel. If you have a query ready, you can just open it in the editor and then execute it by double clicking a topic elsewhere in Wandora. This will open the topic in the current topic panel, which in this case means executing the query using the selected topic as the context. This way you can have a topic panel which gathers information about a selected topic through a customisable query.
Contents |
Opening the topic panel
You can open the query editor topic panel by selecting New panel > Query editor from the View menu. This will open the panel and its subpanels that you use to open or build a query.
Building queries
Basics
Queries are built graphically in the Graph Editor subpanel, which usually occupies most of the space. Please see the separate page query language for details about the general principles behind queries. As explained there, queries consist of directives, each of which perform a specific task. In the graphical editor, directives are represented by grey boxes, with the directive name as the title of the box.
Directives can be moved around the editor so that the structure of the query is easier to grasp. The position of directives in the graph does not affect the behaviour of the directive itself at all.
By clicking the title of a directive you can select it which opens it in the Inspector sub panel, usually at the lower right corner. The parameters and some other details of the directive can be modified here. Note that some of the parameters are reflected in a compact form in the directive box in the editor graph. This is for information only so that it's a bit easier to see what a specific directive does without opening it in the inspector. The parameters cannot be modified in the graph, only in the inspector.
In addition to all the other directives comprising your query, a box titled 'Final result will be present in the graph editor. This isn't strictly speaking a directive but it looks and acts like one. It's a sink where the final result of the query will be taken from. Thus, you'll want to direct the results of your query in there.
Adding directives from the directives list
You can add directives into the graph editor by dragging them from the Directives list subpanel, usually located in the top right corner. The same corner contains the Query library subpanel in a separate tab, you may need to select the list tab to access it.
All the directives are organised in the list by their category. You can add a directive onto the graph editor by dragging it from the list onto the graph. After this, you can move the directive around in the graph, modify it with the inspector and so on.
Connecting directives
In the query language model, directives take as an input a single result row, and usually only use the active value of the row. However the directives are usually organised by using the From directive which essentially makes one directive take any number of rows as input.
Just like the textual script form has a special syntax for using from directives due to their special nature, so does the graphical editor. In the graphical editor from directives are usually represented as arrows going into other directives. The directive boxes themselves have two arrows in the top right and left corners. The arrow in the top left corner represents the output of a directive while the arrow in the top right corner represents the input. You can drag from the output arrow to the input arrow of a different directive to connect the two directives. Behind the scenes, a from directive is created to connect the two directives, but in the graph you will only see an arrow.
It is possible to add from directives as actual directive boxes into the graph by dragging them from the directives list. This however is hardly ever needed and makes the directive graph cluttered.
In the graph you may also have arrows which connect to the bottom of a directive box. These do not represent from directives, they are directives used as parameters for other directives. These are explained in the next section.
